On code coverage and regressions
There are two schools of thought when it comes to code coverage: those who think it is a useless metric and those who think the opposite (OK, I’m a bit exaggerating, there are people in the middle…).
I belong to the second “school”: I have always thought, intuitively, that patches without tests are more likely to cause postrelease regressions, and so having test coverage decreases risk.
A few days ago, I set out to confirm this intuition, and I found this interesting study: Code Coverage and Postrelease Defects: A Large-Scale Study on Open Source Projects.
The authors showed (on projects that are very different from Firefox, but still…) that there was no correlation between project coverage and the amount of bugs that are introduced in the project and, more importantly, there was no correlation between file coverage and the amount of bugs that are introduced in the file.
File coverage vs Patch coverage
So, it seemed to show coverage is not a good predictor at all. I thought though: we are not as interested in existing bugs as we are interested in not introducing new ones. The study showed a file with high coverage has a similar possibility of having bugs than a file with low coverage, but… What happens if we look at things at the patch level?
Maybe those files are covered just incidentally (because their functions are called while running tests for other related files), but the tests were not specifically designed for them.
Maybe the tests were written hastily when those files got introduced, and so they are already full of bugs.
What about if we look instead at whether there is a correlation between patch coverage and the number of regressions that are introduced by those patches?
Of course, correlation is not causation, but we can at least make the case that, when new code is not automatically tested, we should be more careful and review it in more detail, or increase manual testing, or delay it to a new release to get more beta testing.
Data collection
Over the past few years, we have been collecting coverage data about Firefox patches.
It is not fully complete, as it doesn’t include Mac, it doesn’t include all possible Firefox configurations (e.g. Fission) and some languages like Python, but it does include the languages we use the most (JavaScript, C/C++, Rust), and it includes Linux and Windows (considering that a lot of Firefox code is cross-platform, I don’t see the missing Mac as a big limitation).
This means that we excluded the portions of the patches that touch Mac-specific code, Python code, etc., from the analysis.
I collected the data using bugbug and set out to explore it. I got 10938 clean patches, and 2212 buggy ones.
Box plots of bug-introducing vs clean patch code coverage
First, I plotted the data using a box plot:
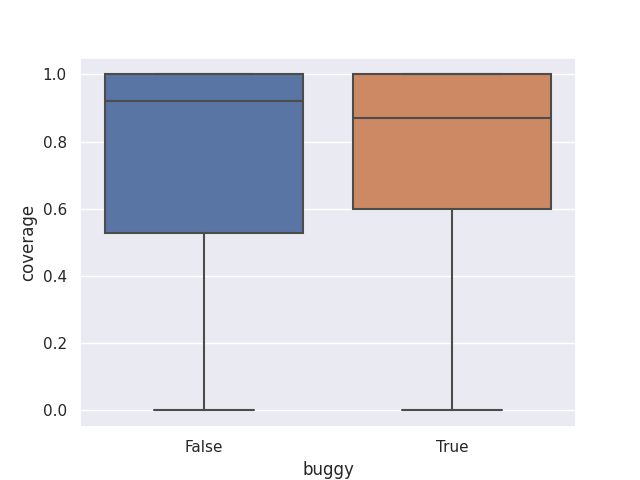
It doesn’t tell me much. The median is higher in the case of “clean” patches though (~92% vs ~87%).
Scatter plot of lines added/covered by bug-introducing vs clean patches
Then, I plotted a scatter plot with “added lines” as the x-axis, “covered lines” as the y-axis, and color being “clean” or “buggy”. What I expected to find: more “clean” patches than “buggy” ones close to the line f(added) = covered (that is, covered == added).
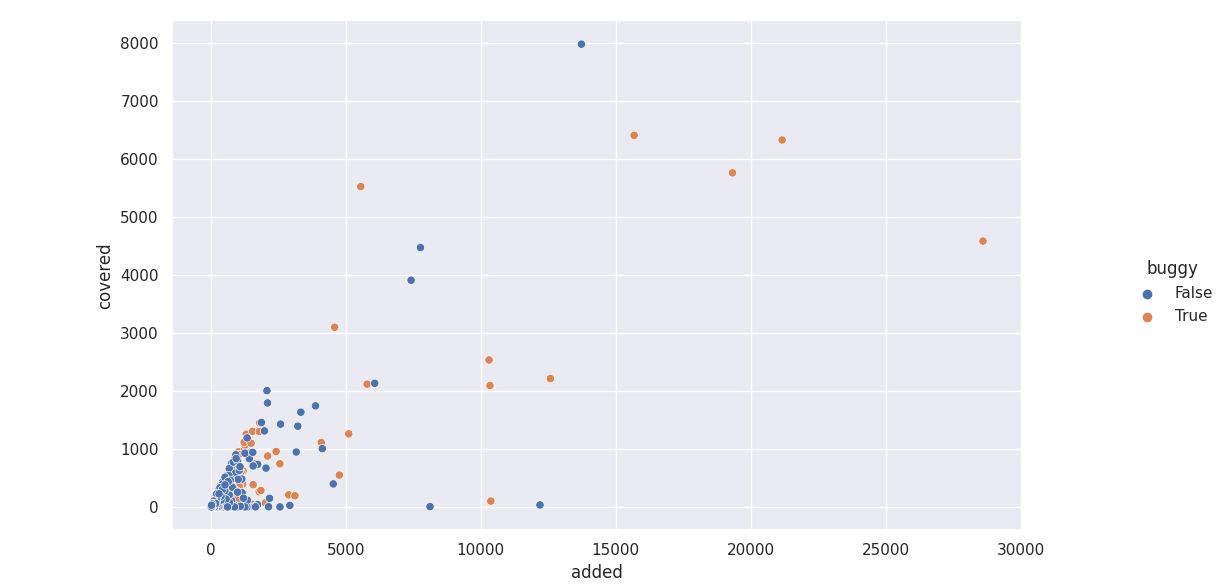
There are a lot of outliers, so let’s zoom in a bit:
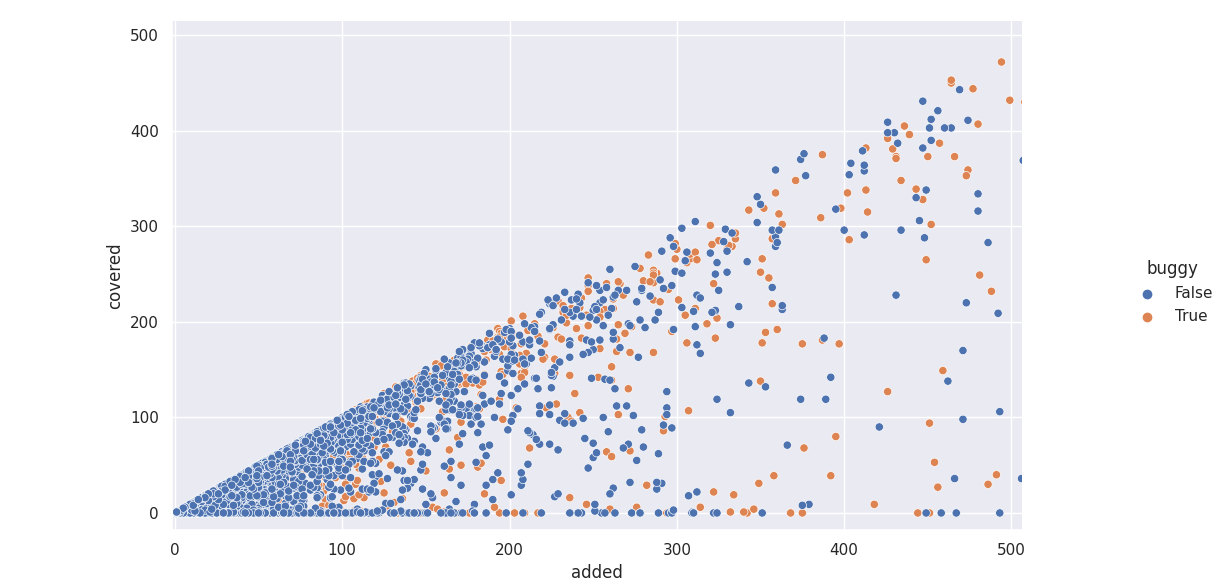
It seems to partly match what I expected, but… hard to tell really.
Distributions of bug-introducing vs clean patch coverage
Next step, plotting two empirical distribution functions for the two distributions. These functions show the proportion of patches, in the two distributions, at or above a given level of coverage (e.g. for the distribution of “clean patches”, when x is 0.8, y is 0.4, which means that 80% of clean patches have more than 40% coverage):
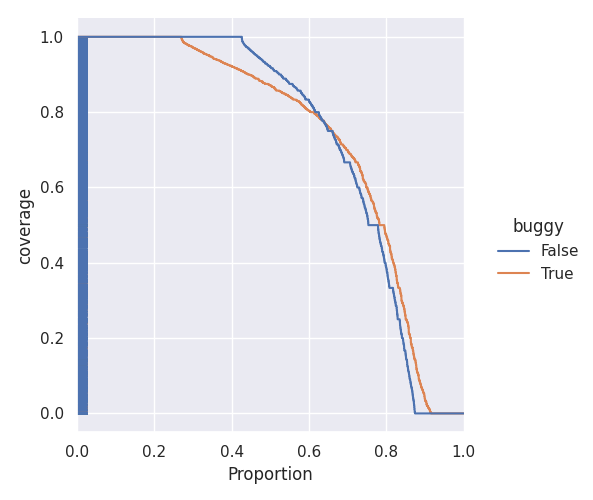
Now, we can clearly see that while 45% of clean patches have 100% coverage, only around 25% of buggy patches have 100% coverage. The proportion of patches that is between 100% and 80% coverage is similar, but non-buggy patches more often present higher coverage than buggy ones. There are no meaningful differences for 40% of the patches (from 0.6 to 1.0 in the chart above).
What I learned
To summarize, we can see that there is a correlation between coverage and bug proneness. In particular, fully covered patches more rarely cause post-release bugs. Of course, correlation does not mean causation. We can’t tell for sure that writing tests for new code changes will reduce the riskiness of those changes, but we can definitely say that we can increase our attention level when changes are not covered by tests.